 English
Metro Accessibility Data Collection
This article describes a methodology of collecting, airtable salesforce integration and producing data on the accessibility of metro/subway/underground stations for different categories of people with limited mobility.
The described methodology was used to collect data for Metro For All project in Amsterdam, Lausanne, Glasgow, Warsaw, Moscow, St. Petersburg, Kazan, Minsk, Kiev, Ekaterinburg, Nizhny Novgorod, Novosibirsk, Samara and Volgograd. The project uses the specific software developed by its members – a system that uses data to construct routes with the description of all potential obstacles on the subway entrance, exit and transfer. This methodology document does not describe the software but only provides a description of the process of collection and preparation of the data.
Resulting data structure
The end result is a collection of several .CSV files and folders with the schematic plans (station layouts) for each city.
Layouts:
– source – files with scanned manual sketches of layouts
– svg – layouts drawn in .SVG
– png – layouts rendered in .PNG (used in applications)
Tables:
– graph – graph of the network
– interchanges – accessibility parameters for transfer routes
– lines – list of lines
– portals – accessibility parameters for entrance/exit routes
– stations – list of stations
Description of creation process for layouts and tables is provided hereinafter.
Preparation
The first thing you need is to choose the best payment option for your travels because you’ll have to enter and leave each station along the way (maybe a few times). Then plan your route for the next few days. It’s possible for one person to collect data on up to 5-6 stations every day. Physically you can go round more, but 1) you will get tired, 2) there is a number of other activities connected with data preparation that take considerable time.
Toolbox
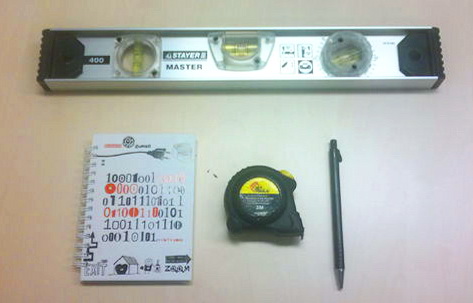
Pen, notebook (normally A5 format, preferably spiral-bound and hardcover), tape measure and inclinometer.
There are 3 types of inclinometers:
– electronic ones;
– builder’s levels with an additional swivel eye with scaled circumference;
– mobile apps. If you’ve got an iPhone or Android phone, you can easily find an app that will measure the slope with sufficient accuracy. First you need to calibrate it on a flat surface, and then put it on the measured slope. Search for an app by keywords: level, angle, meter, etc.
Data collection
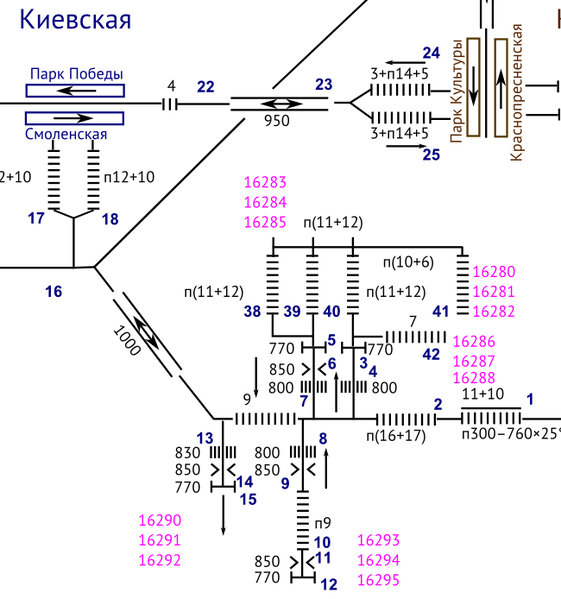
The central part of the system is the station layout. It may be of less importance to the user, but its creation is the main stage of data collection. It contains all raw data, all the changes and updates. It is also a source of all accessibility parameters for the routes.
Layouts are displayed to the end-users, though not in full detail: some service layers in the graphic files provided to the users are switched off.
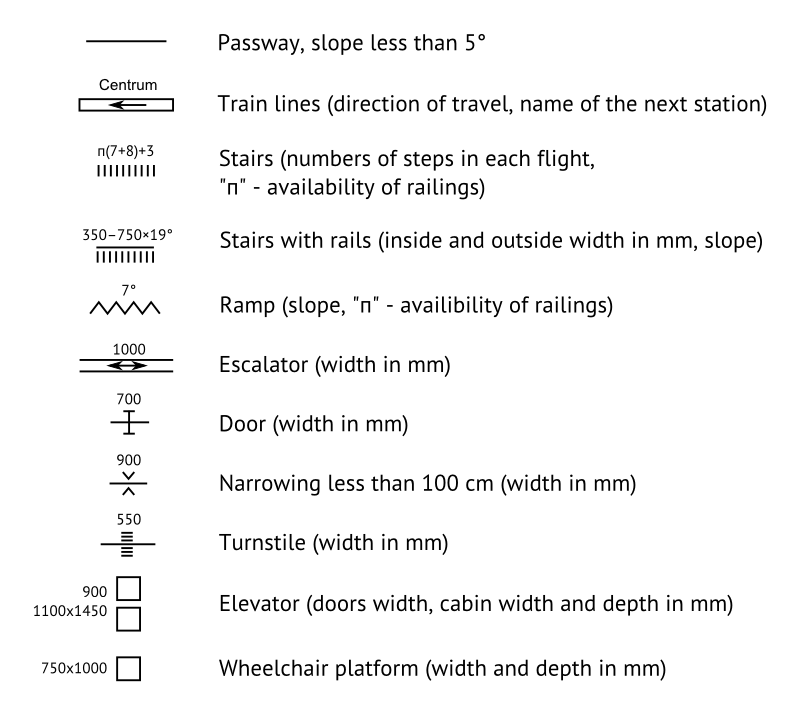
Below you can see the graphic symbols used in the layouts.
Legend for layouts
Note carefully the layout elements listed in the table below. Details associated with each element are described hereinafter.
Layout is created for the transport node. Node is one or more stations combined with passways, for example: “Arbatskaya – Aleksandrovsky Sad – Biblioteka imeni Lenina – Borovitskaya” in Moscow. The node may consist of a single station. The need to introduce the concept of “node” is caused by the fact that some parameters can not be assigned to one specific station of the node.
Layout contains all exits leading from the train platforms to the day surface regardless of whether or not they are operated by the certain transport authority (with the exception of exits leading to shopping malls and railway stations: their insides are not mapped, the entrance to these buildings = exit from the station). The end of the exit route (start of the entrance route) is a long wide stretch of the day surface with a slope less than 5 degrees. Wherever there is an exit out to an area fitting this description, we stop mapping there.
Platforms and train lines
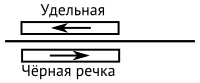
The easiest way to start drawing the layout is from the middle of the train platform. Rectangles with arrows represent train lines, the names identify the adjacent stations, the line between the rectangles is a platform. Depending on whether there is one platform at the station or more, the beginning of the layout can look like this:

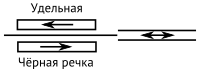
or this:

or this:

It’s better to orient the station from the start to the cardinal points (north up), or if you forgot to do this, insert the arrow pointing to the north.
Dimensions of the train lines are the same for all layouts. The size is arbitrary and does not represent the correct scale between them and passways(platforms). If it looks as if the platform is much longer than train line, it’s ok.
Passways
Suppose that from one side of the platform you can see an escalator, which is connected to the platform via the passway. Then it makes sense to extend the platform passway to the next element – the escalator.
How to draw passways:
1.Length of the passages in the layouts is not necessarily scaled proportionally to the real length.
2.Passways should not reflect all the turns to a dot. This is especially true for multi-level nodes, where it’s preferable to have a readable layout instead of geographically true one.
Escalators
The escalator is indicated on the layout as two parallel lines with arrow(s) between them.
How to draw escalators:
1. Groups of escalator are indicated with one escalator sign using bidirectional arrow.
2. If you are sure that the escalator always works only on ascent or descent, you can use a unidirectional arrow. Otherwise it is better to use a bidirectional one.
Doors, narrowings, turnstiles
Station halls are often much alike: after the escalators you pass through the turnstiles (drawn as short strokes along the passway), then sometimes through doorways without doors (marked with a sign of narrowing) and the doors itself (drawn as brackets).

How to draw doors, narrowings, turnstiles:
1. If there are entrance/exit doors of different widths, the widest door has to be measured.
2. Clear width of the doorway has to be measured: the door at the time of measurement must be in the open position, the narrowest part of the opening is measured
3. Narrowings of passages are indicated only if they are less than 1000 mm.
4. Narrowings can become doors when winter comes.
5. If there are turnstiles of different widths, the widest turnstile has to be measured. Carefully inspect the space near the turnstile: if there is a wider passage (gate, door, etc,) you can use instead of going through turnstiles, measure the width of this passage instead.
Stairs
In the above layout there is a symbol which indicates the presence of stairs after the exit door. The number of steps (4) is recorded after the cyrillic letter “п” which indicates the presence of a handrail.
Sometimes the handrail accompanies only part of the stairs. In this case the record looks like this: “4 + п10”, i.e. 4 steps without handrails and 10 with them. Several flights of stairs separated by stair landings can be drawn as one stairs, thus: “п(10+13+14)” means that stairs consist of 3 flights of 10, 13, 14 steps each, all accompanied by handrails.
How to draw stairs:
1. There are different symbols for short (up to 5 steps) and long stairs.
2. Steps are counted from the bottom to the top of the stairs.
3. Sometimes there is an elevated area by the subway entrances. This area is marked as a one-step stairs, which may be duplicated by rails or ramp.
Stairs with rails
For stairs with rails you need to measure both stairs (see above) and rails. For rails the following parameters are measured and noted: minimum and maximum width of the wheelbase for wheelchair/stroller (i.e. min and max width between the rails), slope (that’s where you need the inclinometer), handrails.
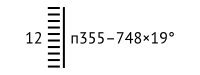
From left to right: the number of steps, handrails for the rails, the minimum and maximum width of the wheelbase, the rails slope.
Ramps
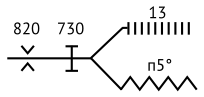
Ramp (leveled surface which usually duplicates steairs, not to be confused with the rails) is indicated with a zigzag. The most important parameter of the ramp is its slope. If the ramp is narrower than 1 meter you can also record its width, in other cases it is sufficient to write down the slope. Letter “п” means that a handrail is present, like in stairs description.
Elevators and wheelchair platforms
Elevators and wheelchair platforms are indicated with squares. Wheelchair platforms are indicated with 1 square, the number of squares for elevators depends on the number of levels they connect (e.g. elevator connecting the platform and the station hall is drawn with 2 squares, similar elevator which connects the platform, the station hall and the day surface is drawn with 3 squares).
It is advisable to measure the following parameters for elevator cars: the width of the doorway, width and depth of the car. If it’s difficult or impossible to get inside the elevator, measure the width of the doorway. For wheelchair platforms length and width of the platform are measured. Also it is advisable to write down the peculiarities of the elevators/platforms work in the layout (for example, that the elevator can be used only after calling the station employee).

How to draw elevators:
1. Squares indicating the elevator should be drawn in one projection (vertical or horizontal) for each level connected by this elevator (day surface, station hall, platform, etc.)
2. In some cases it is advisable to use the dotted line between squares to make it clear that it is the same elevator.
Directions
If the traffic directions are separated (it happens with entrances and exits, and at some transfer routes) it is advisable to mark down the direction of passenger traffic on the layout.

Results
You can fully sketch the station or node with the above elements.
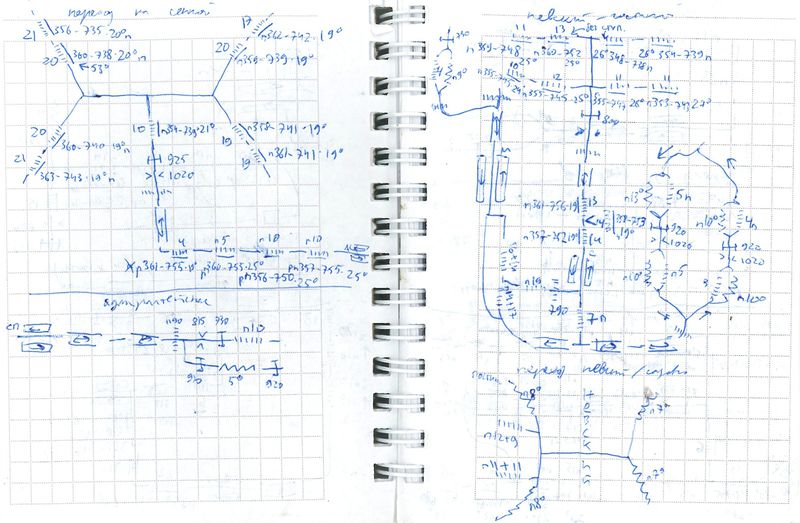
Of course, in notebook this hand-written sketch may look quite sloppy, so it needs to be redrawn in vector format.
Special cases
You are bound to stumble upon unusual solutions at some stations. Somewhere the rails are 3 steps shorter than the stairs they are installed on, somewhere a new super-modern elevator is being tested. Take detailed notes and write down everything that can affect the choice of the route for passengers with special requirements: the disabled, the elderly, people with strollers or bulky luggage. Better to collect extra information than miss important details.
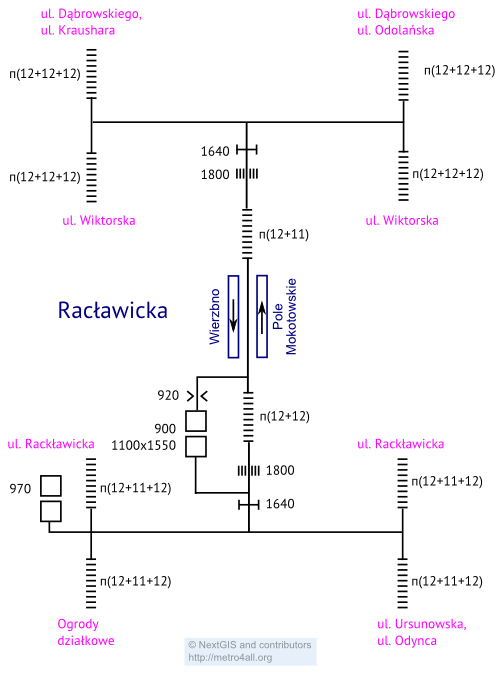
Layouts: Drawing
When data is collected we need to redraw sketches from notepad in vector editor. We use Inkscape (and format .SVG), because it is free, multi-platform and open format, unlike Adobe Illustrator. For running it on Mac you’ll need XQuartz.
First download this file: it has all the right symbols, and one of the stations as an example (Okhotny Ryad). Save them to your computer and open in Inkscape. Some Inkscape basics: to move canvas use middle mouse button, to zoom – Ctrl + scroll wheel. Copy-pasting the character – Ctrl + C, Ctrl + V. To move the object to 1 pixel use arrows while pressing Alt. Instead of copying sometines it’s easier to duplicate (Ctrl + D) and move the duplicated object with arrows. Rotate 90 ° – Ctrl + square brackets ([]), for the usual rotation use double click on the object and drag the corners. Never change the proportion of the symbols!
The layouts use font PT Sans – 14 pt for headings and 8 pt for labels. The colour for all strokes is black, the width for all strokes is 1 “pixel” (not the same thing as a screen pixel). For stroke width to stay the same while scaling, unpress the button “Scale the stroke width” in the toolbar at the top – it’s the first button after the word “Affect”. Turn on panels “Fill and Stroke” and “Align and Distribute” from the menu “Object”. To select several objects for using the prevous function press Shift.
Freehand line is drawn with a yellow pencil button (F6): simply click in the beginning and in the end of the line. If you do it with Ctrl pressed the line will follow the angles 0-45-90°. The line can be extended by clicking on one of its ends. Lines can be edited by nodes with the second from top button (F2). To add arrows on the ends of the lines use “Start markers/End markers” menus in the tab “Stroke style” (use «Arrow1Mstart / Arrow1Mend»).
Settings made with selected tool and unselected objects are stored in memory. For example, if you select the text tool (T) and choose font family and font size before clicking on canvas, these settings will be used for the newly created objects.
If hot keys do not work, check the keyboard layout: Inkscape responds only to English letters.
Layouts: Assigning codes to entrances/exits
When layout drawing is finished you need to assign codes to entrances/exits.
Code sequence (numbering) should be progressive (13010 13020 13021 13030 etc), it is advisable to end the code with 0 so you could add missed entrances/exits later without completely ruining the numbering.
Use the additional layer “exits” for the codes.
To assign a code to an exit visually trace the path from the platform to the surface and assign the code to the end point.
How to assign codes:
1. If the entrance is physically the same as the exit, but the routes from the entrance and for exit are somewhat different (e.g. there’s an escalator installed to exit the platform, but you can’t use it to enter it), the entrance and exit routes should be coded as 2 different routes.
2. If the same physical entrance leads to 2 different stations of transport node, this entrance is assigned with 2 codes.
3. If it leads to several station and is simultaneously serves as an exit point (but the entrance and exit routes are different), the number of codes for one physical entrance/exit can reach 6-8.
Layouts: additional layers
After the basic layout is ready you can start adding optional layers.
– elements-ids – Identifiers of elements – each element of the node infrastructure aside from the passways and train lines is numbered.
– pointers – Wayfinding signs – arrows with numbers. The arrow shows the direction of photography, number – a number of the sign. Pointer is called: X-YYY.jpg, where X is the node code and YYY is the sign number.
– photos – Photos – points, indicating that the objects are photographed. Photo is called: X-YYY.jpg, where X is the node code and YYY is ID of the photographed element.
Data tables
After the layouts are ready and all entrances/exits are coded the aggregated values need to be put into accessibility data tables separately for routes from entrance/exit (portals.csv) and for transfers between lines (interchanges.csv). Each row of the table features separate entrance/exit route or separate transfer route.
")
Accessibility parameters for routes (portals.csv table structure):
1) id_entrance – entrance/exit code
2) name_ru – description of the entrance/exit (in Russian)
3) name_en – description of the entrance/exit (in English)
4) id_station – station code from the table stations.csv
5) direction – the direction of the route, possible values: both (entrance and exit), in (entrance only), out (exit only)
6) lat – latitude of the start/end route point on the day surface (N/A for exits to complex buidings such as shopping malls, train stations, etc.)
7) lon – longitude of the start/end route point on the day surface (N/A for exits to complex buidings such as shopping malls, train stations, etc.)
8) max_width – maximum width of the wheelchair/stroller (i.e. the width of the route bottleneck)
9) min_step – the total number of steps on the route
10) min_step_ramp – the number of steps on the route, not duplicate with ramps or rails (must be less than or equal min_step)
11) lift – the number of elevators on the route
12) lift_minus_step – the number of steps avoided by using the elevators (must be less than or equal min_step)
13) min_rail_width – the greatest width of all inner widths of the rails on the route
14) max_rail_width – the smallest width of all outer width of the rails on the route
15) max_angle – maximum slope of ramps/rails on the route (in degrees)
How to fill the table:
1. Coordinates (latitude and longitude) can be taken directly in the field or taken from OpenStreetMap. We do not use other maps due to licensing restrictions.
2. There can be any number of columns “name_*” according to the number of used languages.
Accessibility parameters for transfers (interchanges.csv table structure):
1) station_from – start station code from the table stations.csv
2) station_to – finish station code from the table stations.csv
3) max_width – maximum width of the wheelchair/stroller (i.e. the width of the route bottleneck)
4) min_step – the total number of steps on the transfer route
5) min_step_ramp – the number of steps on the transfer route, not duplicate with ramps or rails (must be less than or equal min_step)
6) lift – the number of elevators on the transfer route
7) lift_minus_step – the number of steps avoided by using the elevators (must be less than or equal min_step)
8) min_rail_width – the greatest width of all inner widths of the rails on the transfer route
9) max_rail_width – the smallest width of all outer width of the rails on the transfer route
10) max_angle – maximum slope of ramps/rails on the transfer route (in degrees)
Possible directions for project growth
1. Metro accessibility also depends on how easy it is for the passenger to find the way inside the station and near its entrances and exits. So one of our aims is to create a routing application which would find routes with the specified accessibility parameters both inside the metro system and between it and users’ points of interest.
2. In some cities metro is poorly adapted for visually impaired and hearing impaired passengers. One of the possible directions of development for the project is mapping the existing infrastructure for these categories of passengers.
3. Measurements inside the subway are not sufficient to assess its accessibility: exits from the underground stations lead to other mass transit networks, to the railway stations and airports. Another possible direction of growth for the project is mapping the infrastructure of other public transport networks.